
Beyond color: Fluorescence lifetime imaging expands multiplex imaging in living plant cells
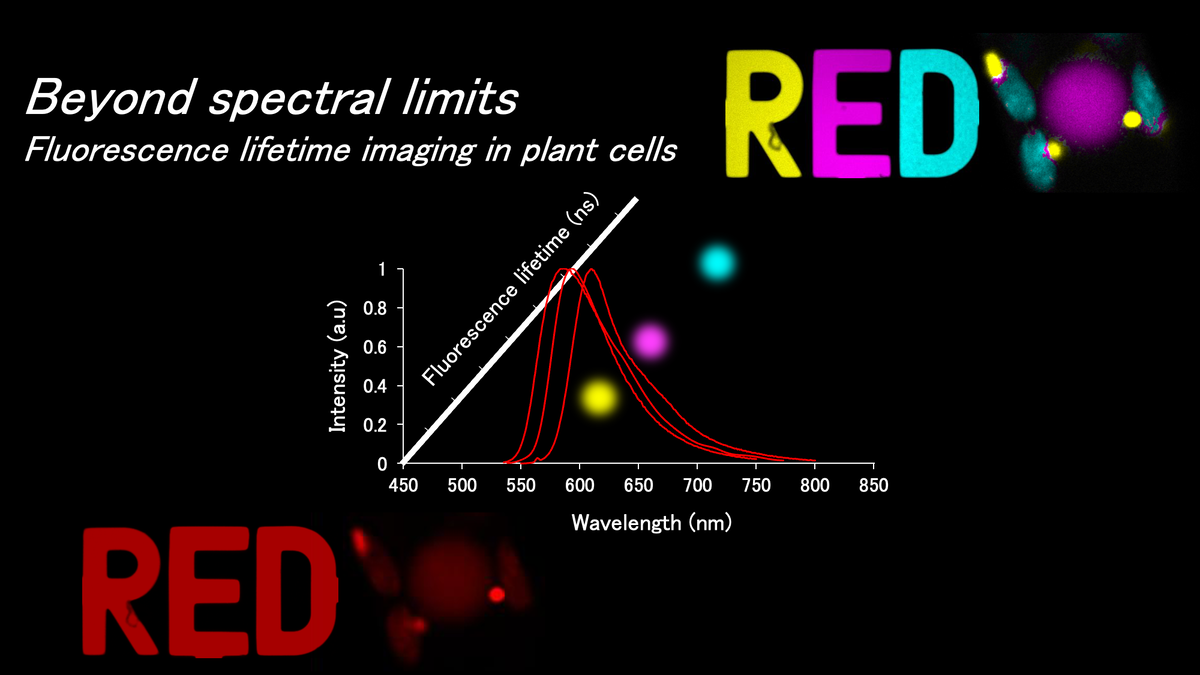
Researchers distinguish multiple fluorescent proteins with overlapping emission colors by their lifetime
Fluorescent protein imaging is an indispensable tool in life science research, enabling visualization of protein movement and localization, gene expression, signaling pathways, protein-protein interactions, and more. For simultaneous analysis of multiple proteins (i.e. multiplex imaging), a variety of fluorescent proteins that emit different colors (blue, green, yellow, and red) have been developed. However, the number of colors that can be distinguished simultaneously is limited, making it difficult to observe and distinguish multiple fluorescent proteins that emit similar colors. Now, researchers from WPI-ITbM at Nagoya University have demonstrated that overlapping colored fluorescent proteins can be distinguished within living plant cells using fluorescence lifetime imaging microscopy (FLIM). This research was published in Plant Physiology on July 30, 2026.
FLIM is a microscopy technique that can capture differences in the fluorescence lifetime of fluorescent molecules as images. While several fluorescent proteins may emit similar colors, their fluorescence lifetimes may differ on the nanosecond timescale. The research team led by researcher Tsuyoshi Aoyama, Nagisa Sugimoto, and Designated Associate Professor Yoshikatsu Sato demonstrated that fluorescence lifetimes can be used to distinguish several fluorescent proteins with overlapping color emissions within plant cells.
First, they analyzed four red fluorescent proteins in vitro--mCherry, mRFP, mApple, and tdTomato. The proteins were indistinguishable using conventional fluorescence intensity imaging, however, FLIM could distinguish them clearly. FLIM data were analyzed using phasor plot analysis, which represents the fluorescence lifetime measured in each pixel as coordinates on a two-dimensional plot. Notably, mCherry and mRFP could be distinguished despite differing by only 3 nanometers in emission wavelength and about 0.2 nanoseconds in fluorescence lifetime.
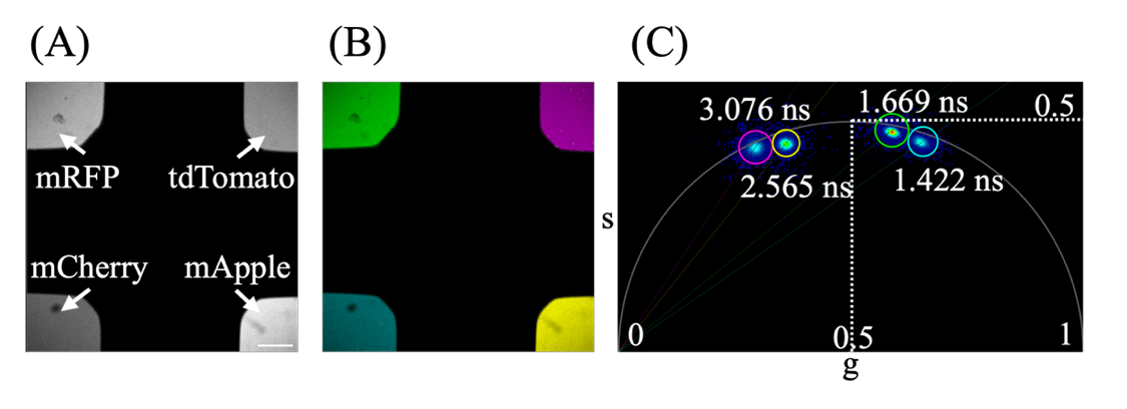 Simultaneous observation of red fluorescent proteins mCherry, mRFP, mApple, and tdTomato in vitro. Panel (A) shows fluorescence intensity imaging, which could not be clearly distinguished. Panels (B, C) show fluorescence lifetime images that are clearly distinguishable. Panel (C) shows the separation of fluorescence lifetimes with Phasor Plot analysis with the signal of each protein shown in different colors in panel (B).
Next, they applied FLIM to in vivo studies by analyzing fluorescent proteins inside poronemal cells of the moss Physcomitrium patens. Each fluorescent protein was localized to different cellular regions, such as the nucleus, peroxisomes, chloroplasts, and plasma membrane. Similarly, while conventional fluorescence intensity imaging proved ineffective, Phasor Plot analysis successfully distinguished each protein based on their fluorescence lifetimes. They demonstrated this with both red (mCherry and tagRFP-T) and green (GFP and NowGFP) emitting proteins, demonstrating the method's effectiveness regardless of emission color.
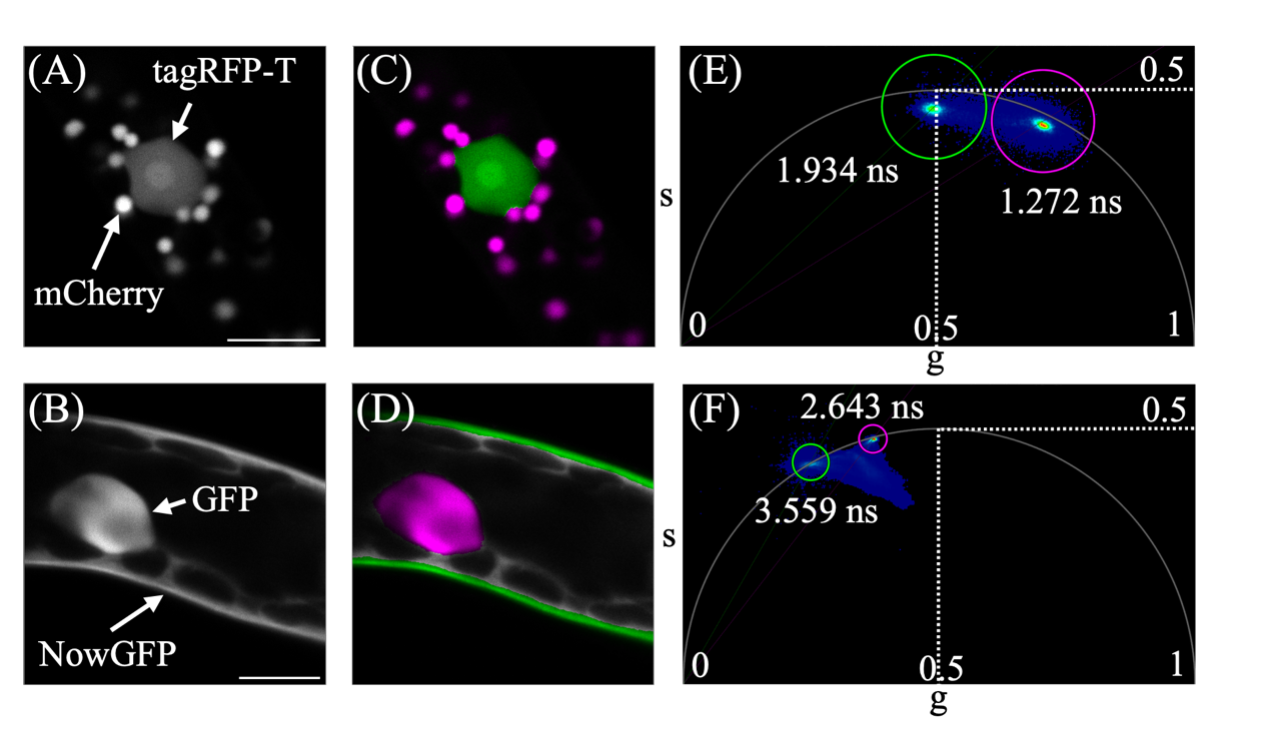
Simultaneous observation of two fluorescent proteins within plant cells. Panels (A, B) show same-colored proteins are indistinguishable by conventional fluorescence intensity imaging. Panels (C-F) are Phasor Plot analyses that successfully distinguished between same-colored proteins. Upper panels (A, C, E) show experiments with red fluorescent proteins (mCherry and tagRFP-T), while lower panels (B, D, F) show experiments with green fluorescent proteins (NowGFP and GFP). These results demonstrate that FLIM data is effective regardless of the color emission.
The research group further demonstrated their method could distinguish three types of fluorescent proteins that were localized to the peroxisomes, nucleus, and chloroplasts. Similarly, they could not be distinguished in fluorescence intensity images but their signals were separated into three distinct populations by phasor plot analysis.
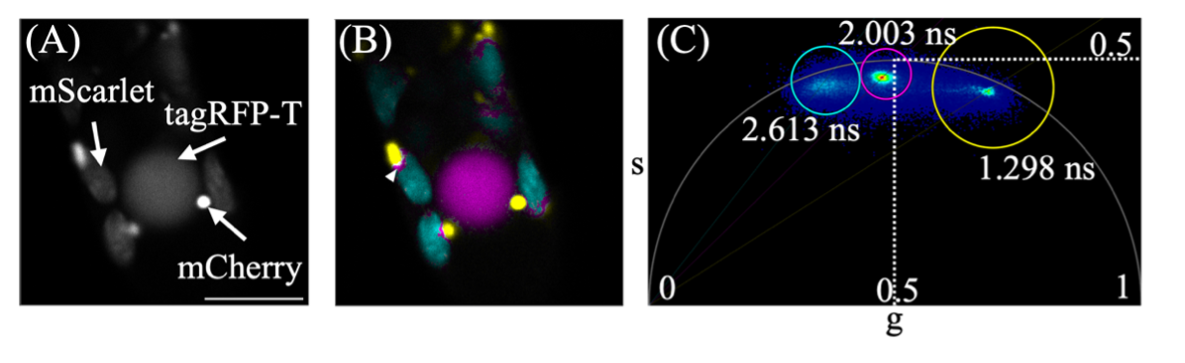
Simultaneous observation of three fluorescent proteins within plant cells. Panel (A) displays fluorescence intensity imaging while panels (B, C) display fluorescence lifetime imaging and Phasor Plot analysis. The arrowhead in Panel (B) shows where an intermediate fluorescence lifetime was observed from the signal overlap between mCherry and mScarlet.
Interestingly, an intermediate fluorescence lifetime was also observed at the boundary regions between adjacent peroxisomes and chloroplasts. This intermediate fluorescence lifetime reflects contributions from both fluorescent proteins and could provide clues for future studies of protein-protein interactions.
In plant cells, distinguishing multiple proteins based on color is intrinsically challenging due to strong autofluorescence that originates from the cell wall and chloroplasts. The researchers expect their new method will make live imaging in plant cells more flexible and help overcome the current limitations on the number of fluorescent proteins that can be observed simultaneously during multiplex imaging.
Information
| Title | Fluorescence lifetime-based multiplex imaging in living plant cells |
|---|---|
| Author | Tsuyoshi Aoyama, Nagisa Sugimoto, Yoshikatsu Sato |
| Journal | Plant Physiology |
| DOI | 10.1093/plphys/kiag475 |
| Date | 2026.7 |